
 + 1 972 387 0080
Richard Jemison’s Point & Figure View of the Markets
~~~PFV tracks 20 Commodity Futures Contracts~~~
- Markets Tracked
- Methodology
- Rick’s P&F Patterns
Sheet #1 — Markets Tracked:
Lumber, Orange Juice, Corn, Soy Beans, Oats, 5-Year T-Notes, Gold, Sugar, Crude Oil and Coffee.
Sheet #2 — Markets Tracked:
10-Year T-Notes, 30-Year T-Bonds, Dollar Index, Cocoa, E-Mini Natural Gas, Silver, Australian Dollar Euro Currency, Wheat, and Cotton.
Sample Issue
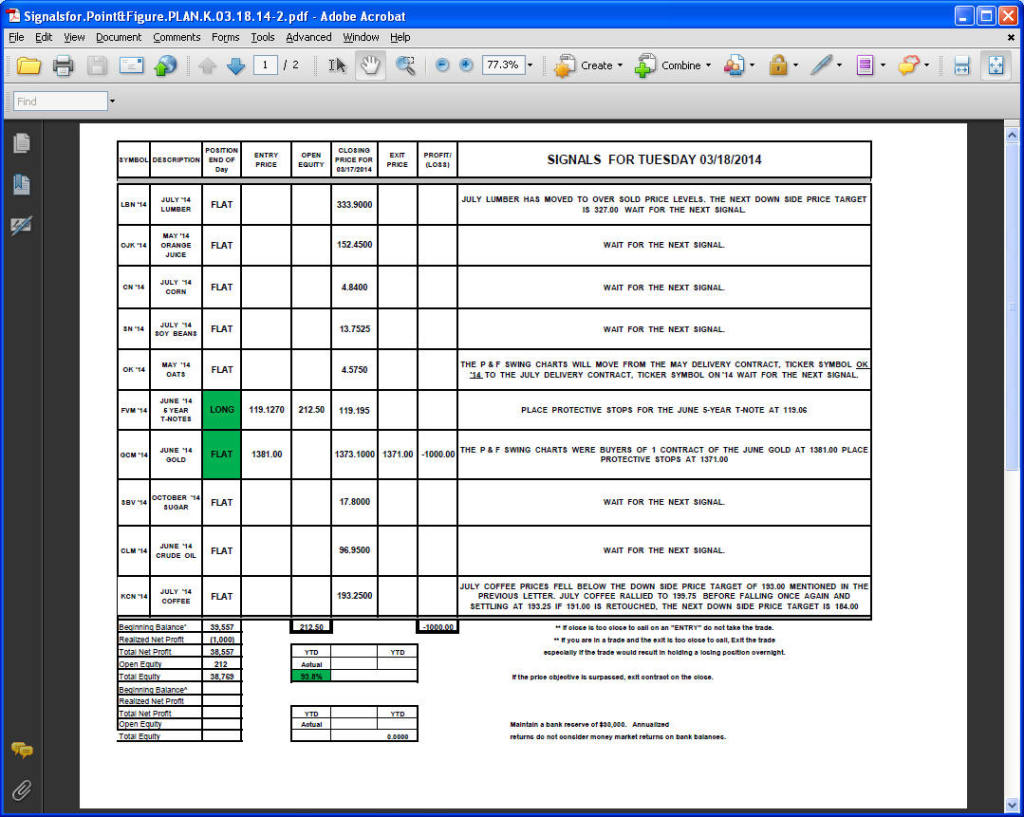
The Methodology Behind The P&F Market View
The Point & Figure method of analyzing movements is designed simply as a logical, organized way of recording the battle between supply and demand. The Point & Figure charts shows whether supply or demand is winning the battle. Chart patterns and trend lines will guide the buy and sell decisions.
Through this unique form of charting market movement distinct patterns routinely develop over time. The chart columns reflecting price through time display swing signals, holding patterns, support and resistance areas and break-out points. By combining Rick’s P&F techniques and patterns with more traditional technical indicators potential trades are discovered.
Sample P&F Patterns
Rick Jemison has recognized and defined a large number of patterns that have guided his trading of point and figure charts. Only three such patterns have been listed.
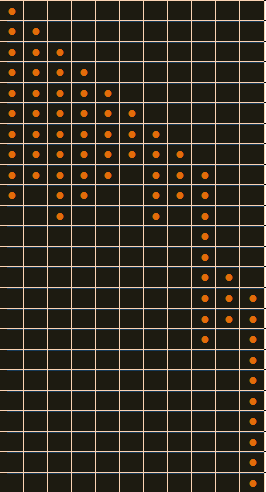
(1). “The Reverse h” — This 3-column swing lower case h to the down side is one of the most powerful patterns in P&F charting. It is second only to a price move straight down. This pattern consistently signals a sustained move to follow.
The Reverse h Pattern

(2). “The Hanging Triangle” — In this formation the P&F holding pattern forms a triangle. As the triangle breaks to the down side it forms a lower case h down — a very bearish signal.
The Hanging Triangle
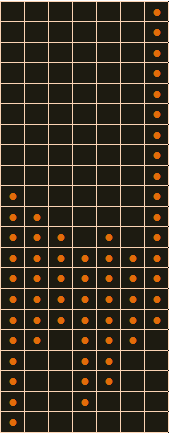
(3). “The Reverse h Up Pattern — Utilizing the same strong 3-column swing lower case h pattern, the Reverse h Up signifies the exhaustion of a move down and the beginning of a substantial move higher. This is a very bullish indicator.
The Reverse h Up Pattern
Rick has recognized and defined a large number of patterns that have guided his trading of point and figure charts. Only three such patterns have been shown. To learn more and work personally with Rick utilizing this dynamic charting and trading newsletter please sign up below.
Sign up for a 2 week free trial to learn more about this valuable tool and have it delivered by email each morning directly to your inbox.

Your subscription includes:
- Daily edition of “The Point & Figure View of Selected Markets”
- List of markets tracked
- Analysis and comments for twenty selected markets
- Explanation of Rick’s methodology of market analysis
- Guide to reading the daily spreadsheets
- Rick’s P&F Trading Rules
Sign up Today!
This material has been prepared by a sales or trading employee or agent of Dallas Commodity Company and is, or is in the nature of, a solicitation. This material is not a research report prepared by Dallas Commodity Company's Research Department. By accepting this communication, you agree that you are an experienced user of the futures markets, capable of making independent trading decisions, and agree that you are not, and will not, rely solely on this communication in making trading decisions.
The risk of loss in trading commodity futures contracts can be substantial. You should therefore carefully consider whether such trading is suitable for you in light of your financial condition. You may sustain a total loss of the initial margin funds and any additional funds that you deposit with your broker to establish or maintain a position in the commodity futures market.